To be able to debug Go programs in Atom, make sure the Go IDE is installed. See Install the Go IDE at Install and set up Go
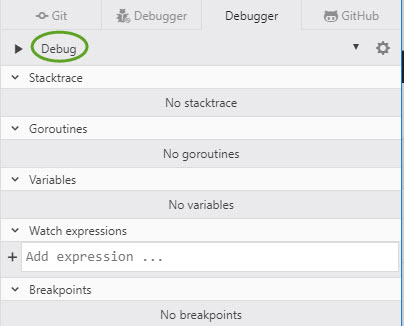
To start debugging select the Debugger tab in the upper right corner of Atom
![]()
If you get the error message: The debugger is not attached, and when you click Attach debugger you get the error message: No debuggers installed, look for available debuggers on atom.io/packages
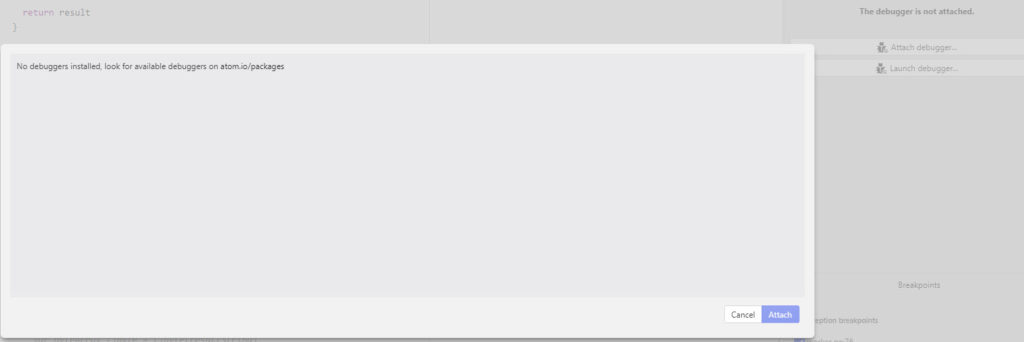
Check if the go-debug Atom package is installed
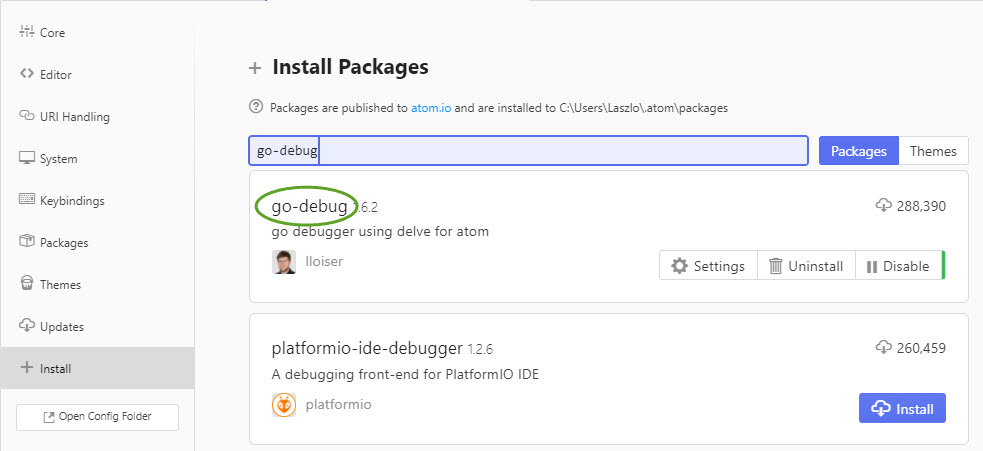
- Open the Settings page from the File menu
- Select Install on the left side
- Search for go-debug
- If the package is not installed, click the Install button
If you still get the same error message, download the go-delve package.
Visit https://github.com/derekparker/delve/tree/master/Documentation/installation for more info.
- In the terminal window execute
go get -u github.com/go-delve/delve/cmd/dlv
- Restart Atom for the change to take effect.
To debug your Go application
- Click the Debugger tab in the upper right corner, and select the Debug config
- To set a breakpoint, click the line in the program and press the F9 key. A red circle appears on the margin.
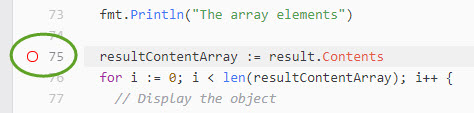
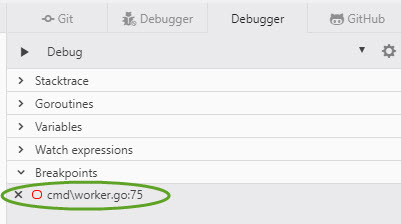
- The breakpoint appears on the right side of the screen too
- Press F5 to run the application in the debugger
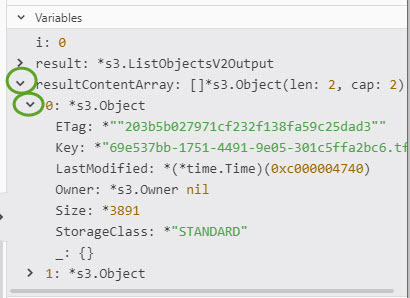
- When the breakpoint is hit the toolbar on the right side shows the Stacktrace and the Variables. Click the arrow to open the section.
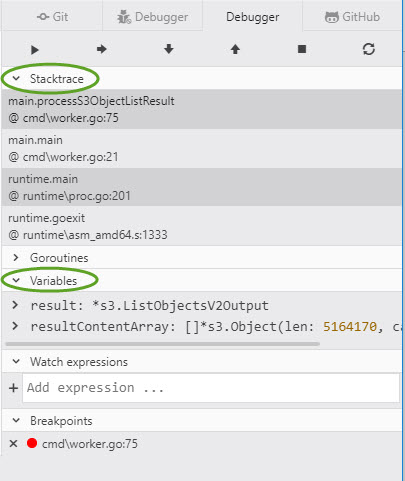
- Click the arrow next to the variable name to show more details