View two files side-by-side
- Open the Project Navigator
- Click the first file in the Navigator
- Option-Click the second file in the Navigator
The two files are displayed next to each other, so you can compare them and copy code between them.
Using tabs
In the Apple Xcode IDE you can use tabs to quickly switch between documents.
It looks like tabs are not the native way to open documents, because opening documents in tabs is not so intuitive. To open a document in a new tab:
- In the View menu select Show Tab Bar. This will show an empty bar for the tabs.
- In the File menu select New -> Tab. The currently open document appears again in the new tab.
- To open another document in a new tab
- In the File menu select New -> Tab. The same, currently selected document opens third times in the new tab.
- Select a new document in the project navigator for the new tab.
The positive side of this is that the multiple instances of the same document are synchronized, so a change in one instance is instantly reflected in the other instances.
Using multiple windows
The advantage of this setup is to be able to configure the separate Xcode windows differently, for example one for code editing, the other for graphical view design.
- In the File menu select New -> Window
Set up debugging
With the default settings in Xcode if there is an error in your app the user interface does not display the line where the error occurred. You can instruct Xcode to stop the execution on the line of code that will cause an error:
- In the Debug menu select Breakpoints -> Create Exception Breakpoint…
Xcode creates a new breakpoint called All Exceptions. When an exception (error) happens in your application Xcode will stop on the line that caused it.
Debug your app in the iOS Simulator or on your Apple device
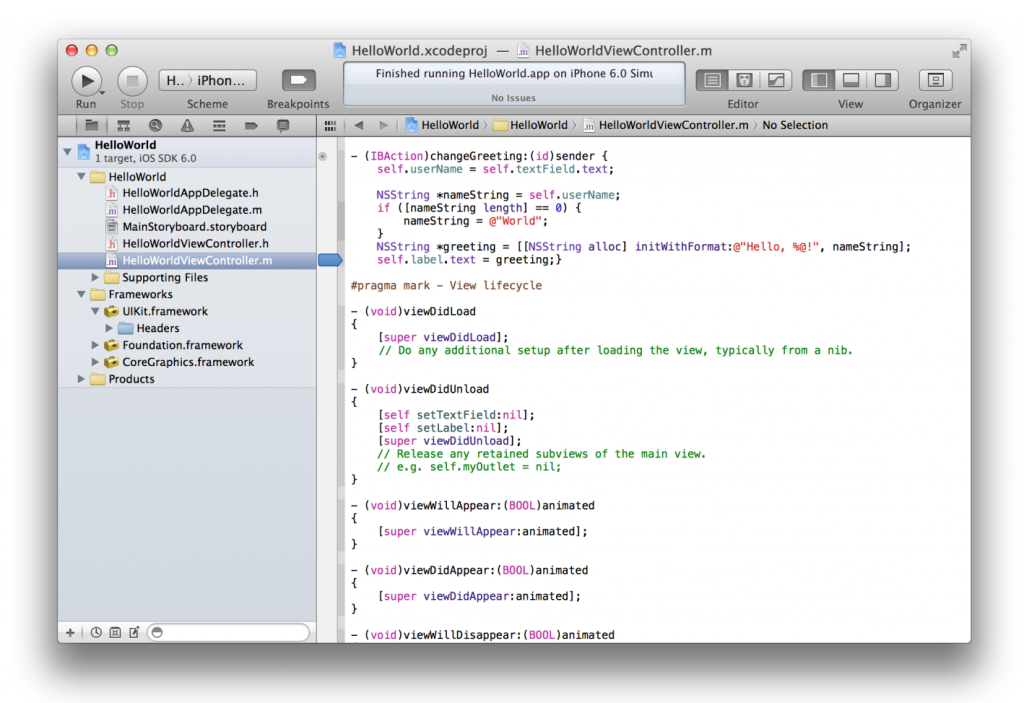
- Open the …ViewController.m on the project navigator
- Find the self.label.text = greeting; statement close to the end of the file
- Click the gutter (the wider light gray area) on the left side to place a break point
- Select the iPhone Simulator scheme next to the Stop button on the top of the screen
- Click the Run button to execute the application in the iOS simulator
- In the simulator enter your name in the text field
- Click the Done button on the virtual keyboard
- Click the Hello button on the simulator screen
- The program execution will stop at the break point and show the selected line in the code editor
To remove the break point click and drag it away from the gutter
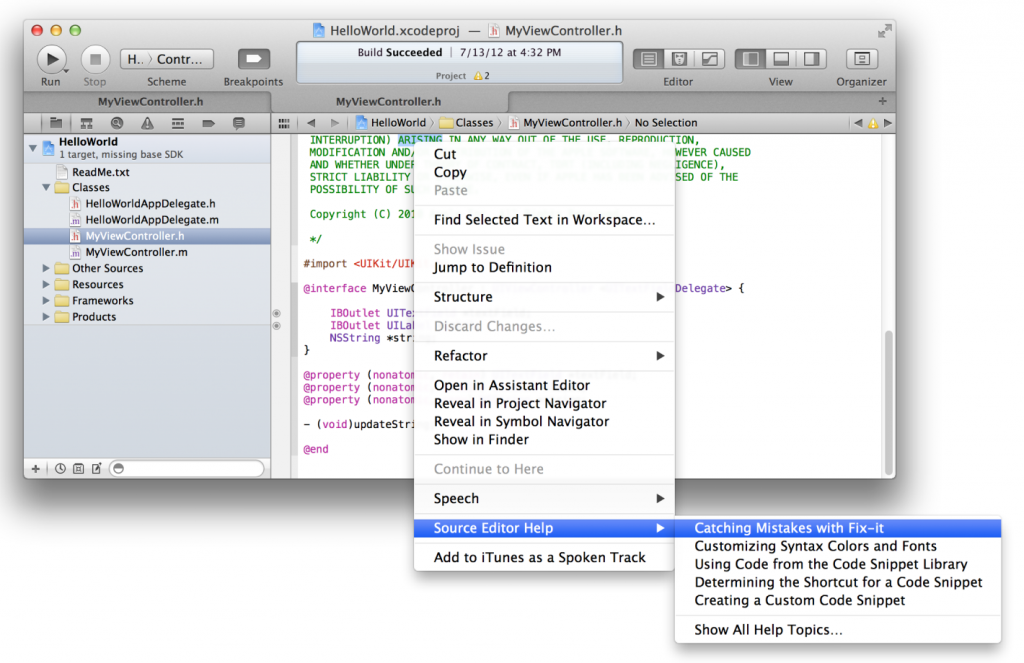
Accessing the Xcode Help
- Control click anywhere in the code editor
- In the pop- up context menu one of the last items is the Source Editor Help
Monitor the performance of your app
- Start Xcode and open your project
- In the Product menu select Perform Action -> Profile Without Building
- The Profile window opens
- On the left side select All to see all available tools
- For example to test for memory leaks select the Leaks template and click Profile
- Use the application in the simulator to provide data for the profiler
- In the iOS Simulator menu select Quit iOS Simulator to close the simulator
- The Allocations option on the left side shows the memory allocation history during the execution
Manage versions of your app
Xcode can create snapshots to store multiple versions of your app in case you make a modification that stops your app working, or you accidentally delete your source code
To manually create a snapshot
- In the File menu select Create Snapshot
- Enter a name for the snapshot, so later you can find it
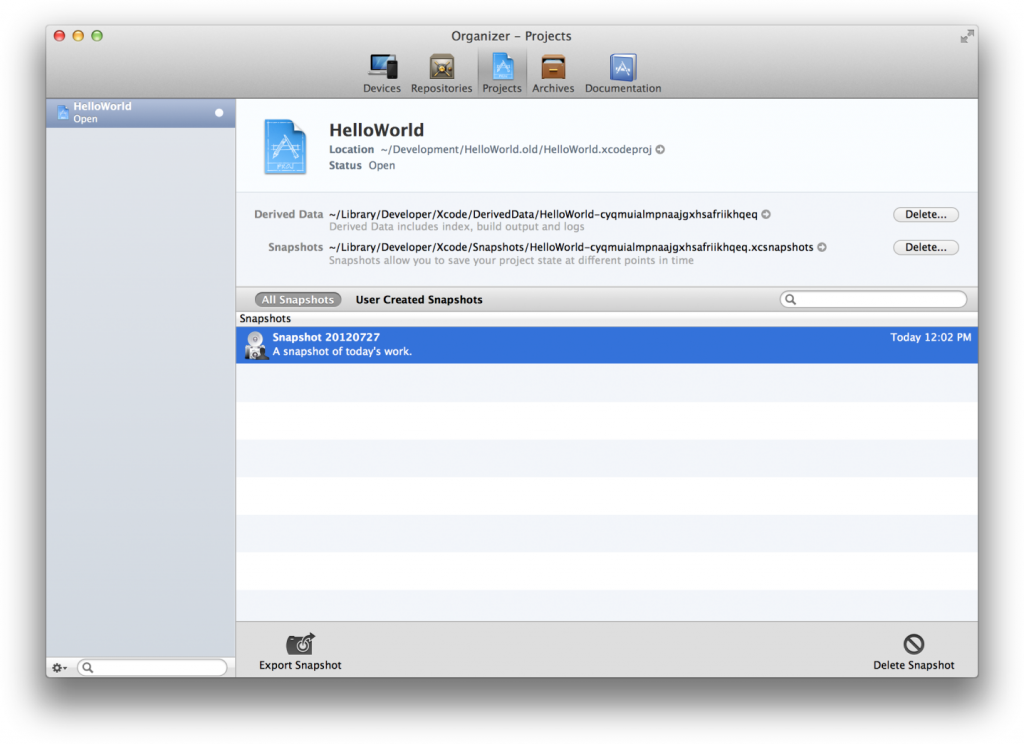
To see the snapshots
- Open the Organizer in the upper right corner of the screen
- Click the Project button on the top of the window
Xcode also supports the Git and Subversion source control management systems (SCM) to coordinate work among multiple developers.