To display dynamic data on Lucid Charts. we can link Google Sheets to Lucid Chart objects. The Pull fill color from Google Sheets section of the Lucid documents explain how to set the color of an object based on the cell color, but does not mention one important step. To be able to select the Apply Imported Fill Color option, first, we have to change the background color of the Google Sheet cell to any color.
In the Google Sheet
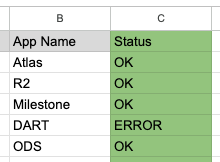
- Select the header of the status column,
- Set the background of the entire column to any color.
In Lucid Charts
- Assign the cell to an object.
- Click the three dots next to the column name.
- Select Apply Imported Fill Color.
When we change the background color of the cell in Google Sheets the color of the object will change too.