When we activate the Debug feature of Visual Studio Code, the Terminal displays the console output.
To find the correct location of data among the objects and variables, we can use the Debug Console.
Start the application in debug mode
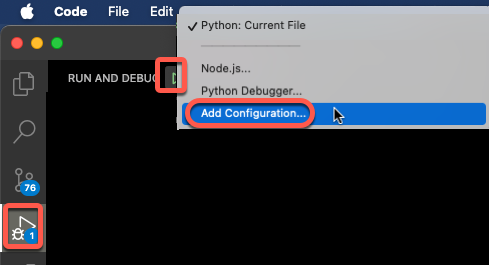
- Set up your application in the debug configuration file

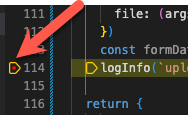
- Set a breakpoint in your code by clicking the margin. When you add or remove a breakpoint, you always have to stop and start the debug session for the debugger to notice the change.

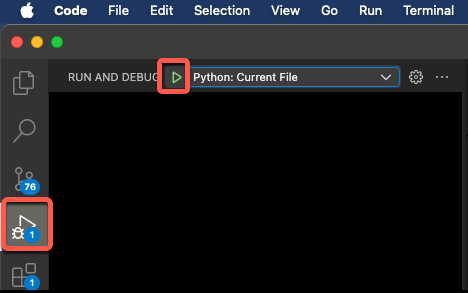
- Start the application with the debugger

Explore the object and variable values in the Debug Console
- Select the Debug Console at the bottom of the screen

- Type the name of the object to see its value

- Expand the elements to see their structure

- Use dot notation to display the value of elements. Use the same in your code to access the value runtime.
