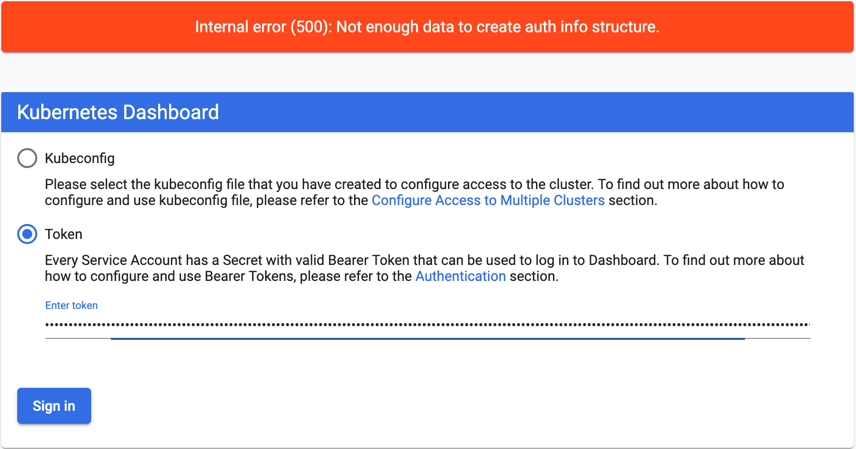
This is the official Kubernetes dashboard, and for security reasons currently it is not recommended to use, but we can still use it in our local cluster to inspect the resources.
The latest installation information is at https://kubernetes.io/docs/tasks/access-application-cluster/web-ui-dashboard/
Launch the Kubernetes Dashboard
To launch the Kubernetes Dashboard in your cluster execute the command
kubectl apply -f https://raw.githubusercontent.com/kubernetes/dashboard/v2.0.0-beta1/aio/deploy/recommended.yamlCreate a proxy to access the cluster. The proxy will run in the background, to stop it when not needed anymore press CTRL-C.
kubectl proxyTo open the Kubernetes Dashboard web UI in a web browser navigate to http://localhost:8001/api/v1/namespaces/kubernetes-dashboard/services/https:kubernetes-dashboard:/proxy/
Start the Kubernetes Dashboard
If you get the error message: Internal error (500): Not enough data to create auth info structure.
- Execute the commands to add the token to the ~/.kube/config file
TOKEN=$(kubectl -n kube-system describe secret default| awk '$1=="token:"{print $2}')
kubectl config set-credentials kubernetes-admin --token="${TOKEN}"- Copy the token from the ~/.kube/config file to the login screen
