Skip to content
Pinter Computing

Knowledge Base for IT Professionals, Teachers, and Astronauts

Pinter Computing

Knowledge Base for IT Professionals, Teachers, and Astronauts

  • Home
  • Programming
  • DevOps
  • Project Management
  • Software and Hardware
  • Miscellaneous
  • Egyebek
  • About
  • Experience
  • Education
  • Contact
  • Home
  • Programming
  • DevOps
  • Project Management
  • Software and Hardware
  • Miscellaneous
  • Egyebek
  • About
  • Experience
  • Education
  • Contact
Close

Search

Home/Knowledge Base/Debugging React Web Applications
Knowledge Base

Debugging React Web Applications

By Laszlo Pinter
February 27, 2026 2 Min Read
0

React web applications run code at two places.

Server side

  • First the server executes the server side code to access databases, call APIs and other backend resources usually to retrieve data. This is coded in the loader() and action() functions in the React Router (formerly Remix) framework.
  • Depending on the specific React framework it may performs Server Side Rendering (SSR) to generate the HTML that the browser can quickly display to the user without putting much load on the client device.

Client side

  • The browser executes the client side code and displays the web page. This is coded in the remaining exported function, like
    export function FileUploader()

As we can see, our application runs at two separate locations, so we need to debug them, at those places too.

Debugging the server side code

To debug the server side code, we can start the application in the Visual Studio Code Debugger

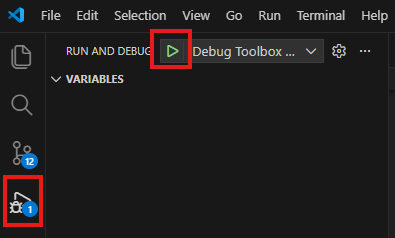
and set breakpoints in the code editor margin

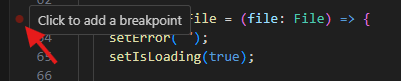
If we picked the correct function, and the code really runs on the server side, the execution will stop when it reaches that point. If the breakpoint is ignored, most likely that function is executed in the browser, so we need to debug it there.

Debugging the client side code

To debug the code that runs in the browser, we use the same Debugger in Visual Studio Code,

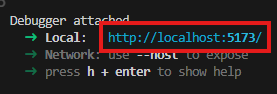
but set the breakpoint in the Developer Tools of the Chrome browser. When the application started in the Visual Studio Code debugger

  • Click the link to open the local URL with the default browser. IN this example we use Google Chrome to run the site and debug the client side code.
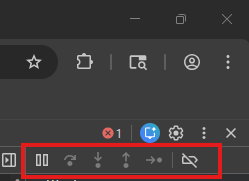
  • Press F12 to open the Developer Tools
  • On the Sources tab select the program file to debug and click the margin to set the breakpoint
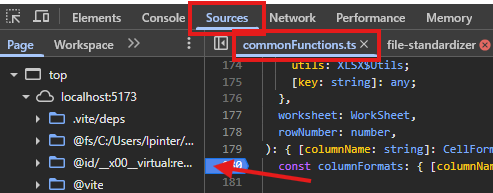
  • When the code execution reaches that point, the application will stop, so you can investigate variable values, step through instructions with F10. See the debug panel in the upper right corner for other functions.

Author

Laszlo Pinter

Follow Me
Other Articles
Previous

Running MSSQL Server in a local Docker container

Next

Set up Easy Auth with Microsoft Azure Entra ID

No Comment! Be the first one.

Leave a Reply Cancel reply

Your email address will not be published. Required fields are marked *

Search

Last Changes

  • DevOps Engineering part 1. (Mac) - Make your Macintosh easier to use June 25, 2026
  • Japan travel tips June 22, 2026
  • How to stop the rain and snow in Cities: Skylines II June 20, 2026
  • Cities: Skylines II Developer Mode June 20, 2026
  • 'CSII_MANAGEDPATH' has incorrect path(s) when building Cities: Skylines II mod June 20, 2026

Tags

.NET .NETcore 3Dprinting ASP.NET Core AutodeskInventor AWS C# Chef cloud DevOps Docker EntityFramework Games Git Go iOS iPad iPhone iPod Java Kubernetes Linux MacOSX MSSQL MVC Node.js Packer PowerShell Python RDS RightScale Ruby security Splunk TeamCity Terraform TestKitchen Tomcat Ubuntu Vagrant VirtualBox VisualStudio Windows WordPress Xcode

Recent Comments

  • Zengei László on MyHeritage családfa exportálása és küldése emailben
  • Raúl Castillo on DynDns update error
  • MICHAEL on Windows Media Player 12 cannot find the album information
  • Nargis on Configure Epson ET-3850 scanning on Windows 11
  • Venczelné Zemen Erika on Delta S2302 termosztát programozása

–

  • Log in
  • Entries feed
  • Comments feed
  • WordPress.org
Copyright 2026 — Pinter Computing. All rights reserved.